Exploratory Data Analysis
pythonforfinance
About This Course
This course provides a comprehensive exploration of the role and techniques of data visualization in the context of Exploratory Data Analysis (EDA). Data visualization is a powerful tool for transforming complex datasets into intuitive and actionable insights. Participants will delve into the principles, purposes, and types of data visualization, understanding how visual representations enhance the analysis of patterns, trends, and outliers within data.
This course provides a comprehensive exploration of essential concepts in Exploratory Data Analysis (EDA), Data Visualization, and practical application using Power BI Desktop. The course is structured into three modules, each dedicated to a specific topic.
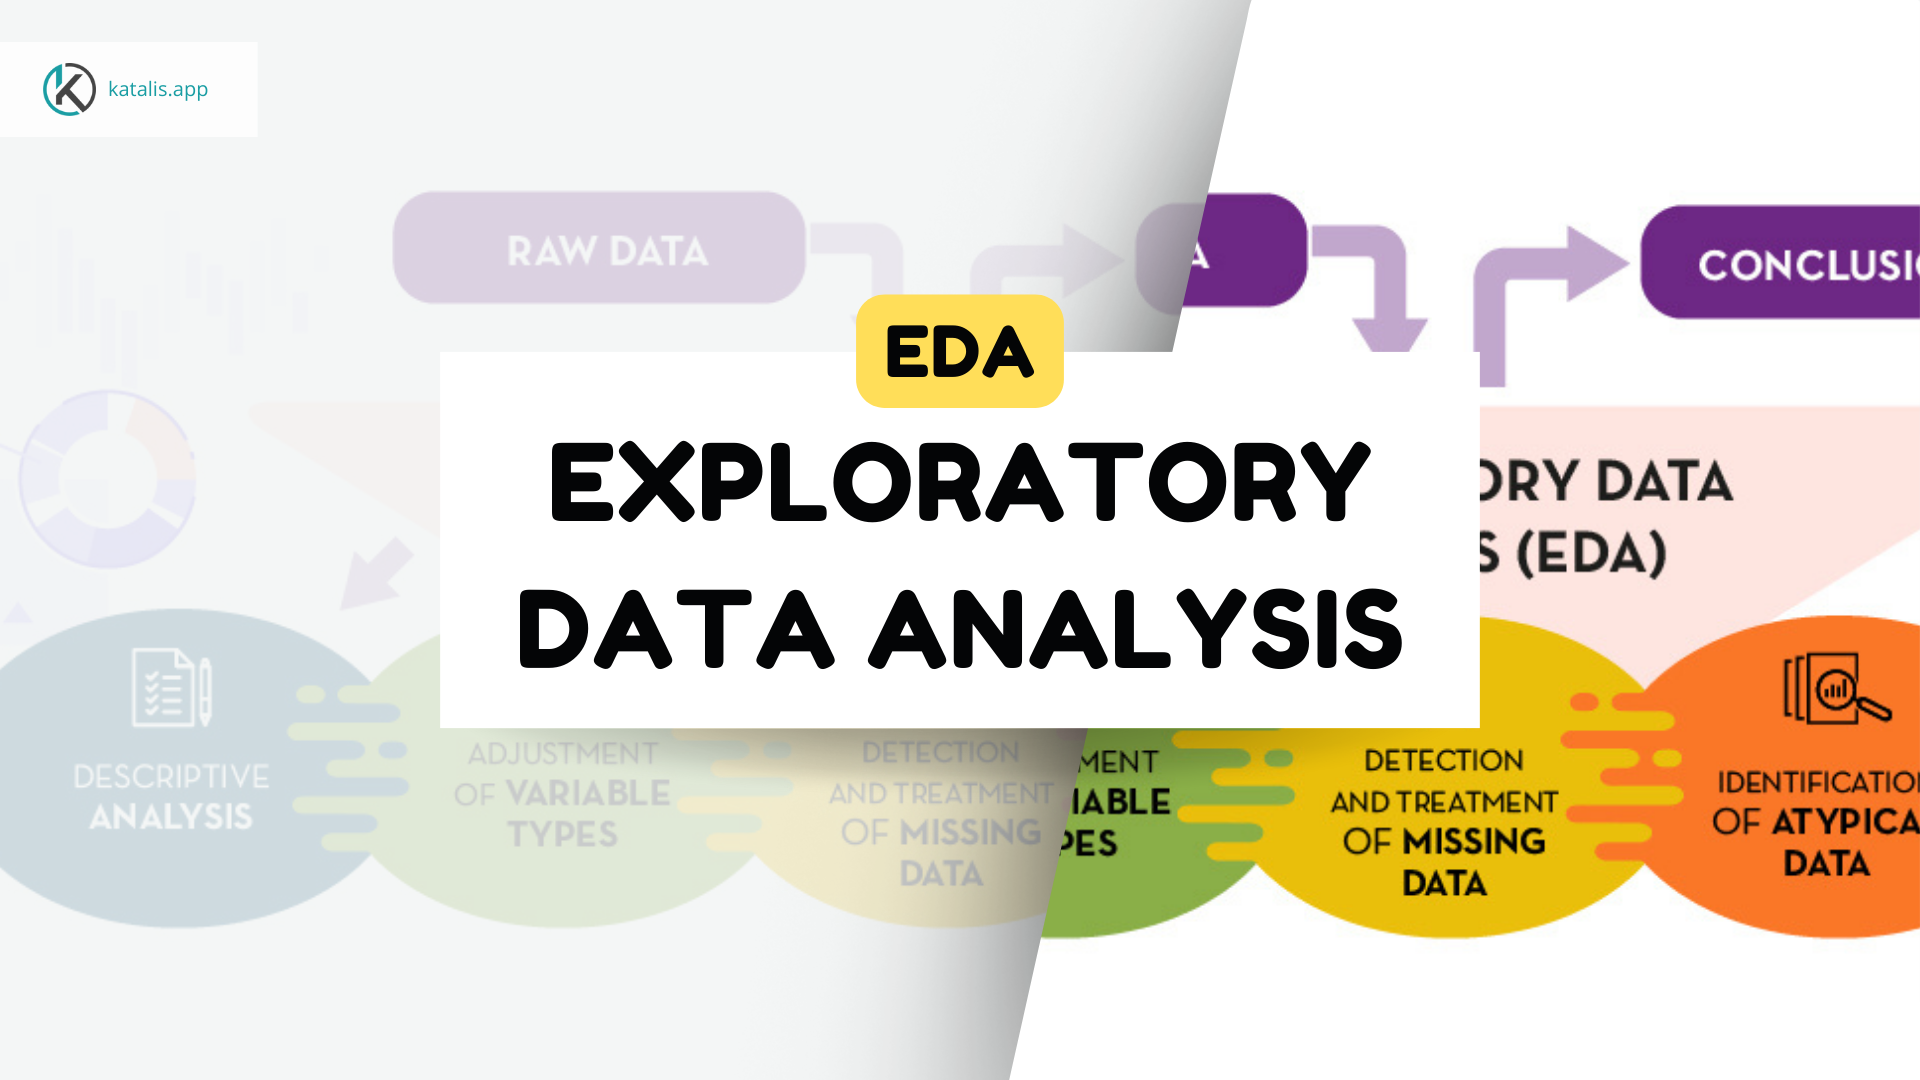
Exploratory Data Analysis -> estimated time = 60 minutes
The first module aims to introduce students to the concept of Exploratory Data Analysis. Students will be provided with a video-based learning experience and text material that will provide an understanding of the underlying principles of EDA. Upon completion of the video, students will be evaluated on their knowledge through a quiz consisting of 15 multiple-choice questions. Here are the sections that exist in this module:
Data Visualization -> estimated time = 60 minutes
The second module of this course centers on equipping students with a thorough comprehension of Data Visualization. Through a combination of video-based instruction and supplementary text materials, students will delve into the diverse aspects of Data Visualization, including essential techniques and tools.
To assess their understanding of the material covered in the video, students will be required to complete a quiz consisting of 15 multiple-choice questions. This quiz will serve as an important tool to evaluate their mastery of the concepts and to identify any areas where additional clarification may be required. Here are the sections that exist in this module:
Hands-On Power BI -> estimated time = 45 minutes
The third module of this course is dedicated to providing students with practical skills in utilizing Power BI for effective Data Visualization. Through a combination of video-based instruction and hands-on, students will engage with hands-on activities to reinforce their understanding of Data Visualization concepts using Power BI.
To assess their understanding of the material covered in the video, students will be required to complete case study to implement Power BI. This case study will serve as an important tool to evaluate their mastery of the concepts and to identify any areas where additional clarification may be required. Here are the sections that exist in this module:
By the end of this course, students will have a solid understanding of Exploratory Data Analysis and Data Visualization with how to apply it to finance-related tasks.